Examples
The example gallery lists nine saved sessions. Open one to inspect its tree, metadata binding, tracks, view, and diagnostics. The live manifest is the machine-readable catalog.
Open an example from its preview or its Open session button on the app's landing page. Sessions also lists the examples while a tree is open. Opening an example replaces the current tree in that tab, so save your session first. Changes to the opened copy do not change the public example. For a small example built step by step, follow Your first annotated tree.
Each gallery card lists the paper title, first author, citation year, figure and DOI. It links Session, Tree, Metadata and, where one exists, Config. Expand Recreate this style in the landing gallery or Sessions panel for a reusable prompt with the required metadata formats. Copy prompt and Download prompt provide the same text. Give it to an AI assistant with your tree and metadata files. To reproduce the published figure, open its session. To apply the style to your own data, use the prompt.
Every example below starts with its data, tip count, and layout. After that come links to the session, the SVG figure, the source paper, the style prompt, and the hosted files.
The prompts specify leaf tables, internal-node attributes, optional display coordinates and synthetic values. A leaf table alone does not supply values for internal nodes.
Example 1: Mirusviricota
Sourced data · 1,204 tips · circular tree
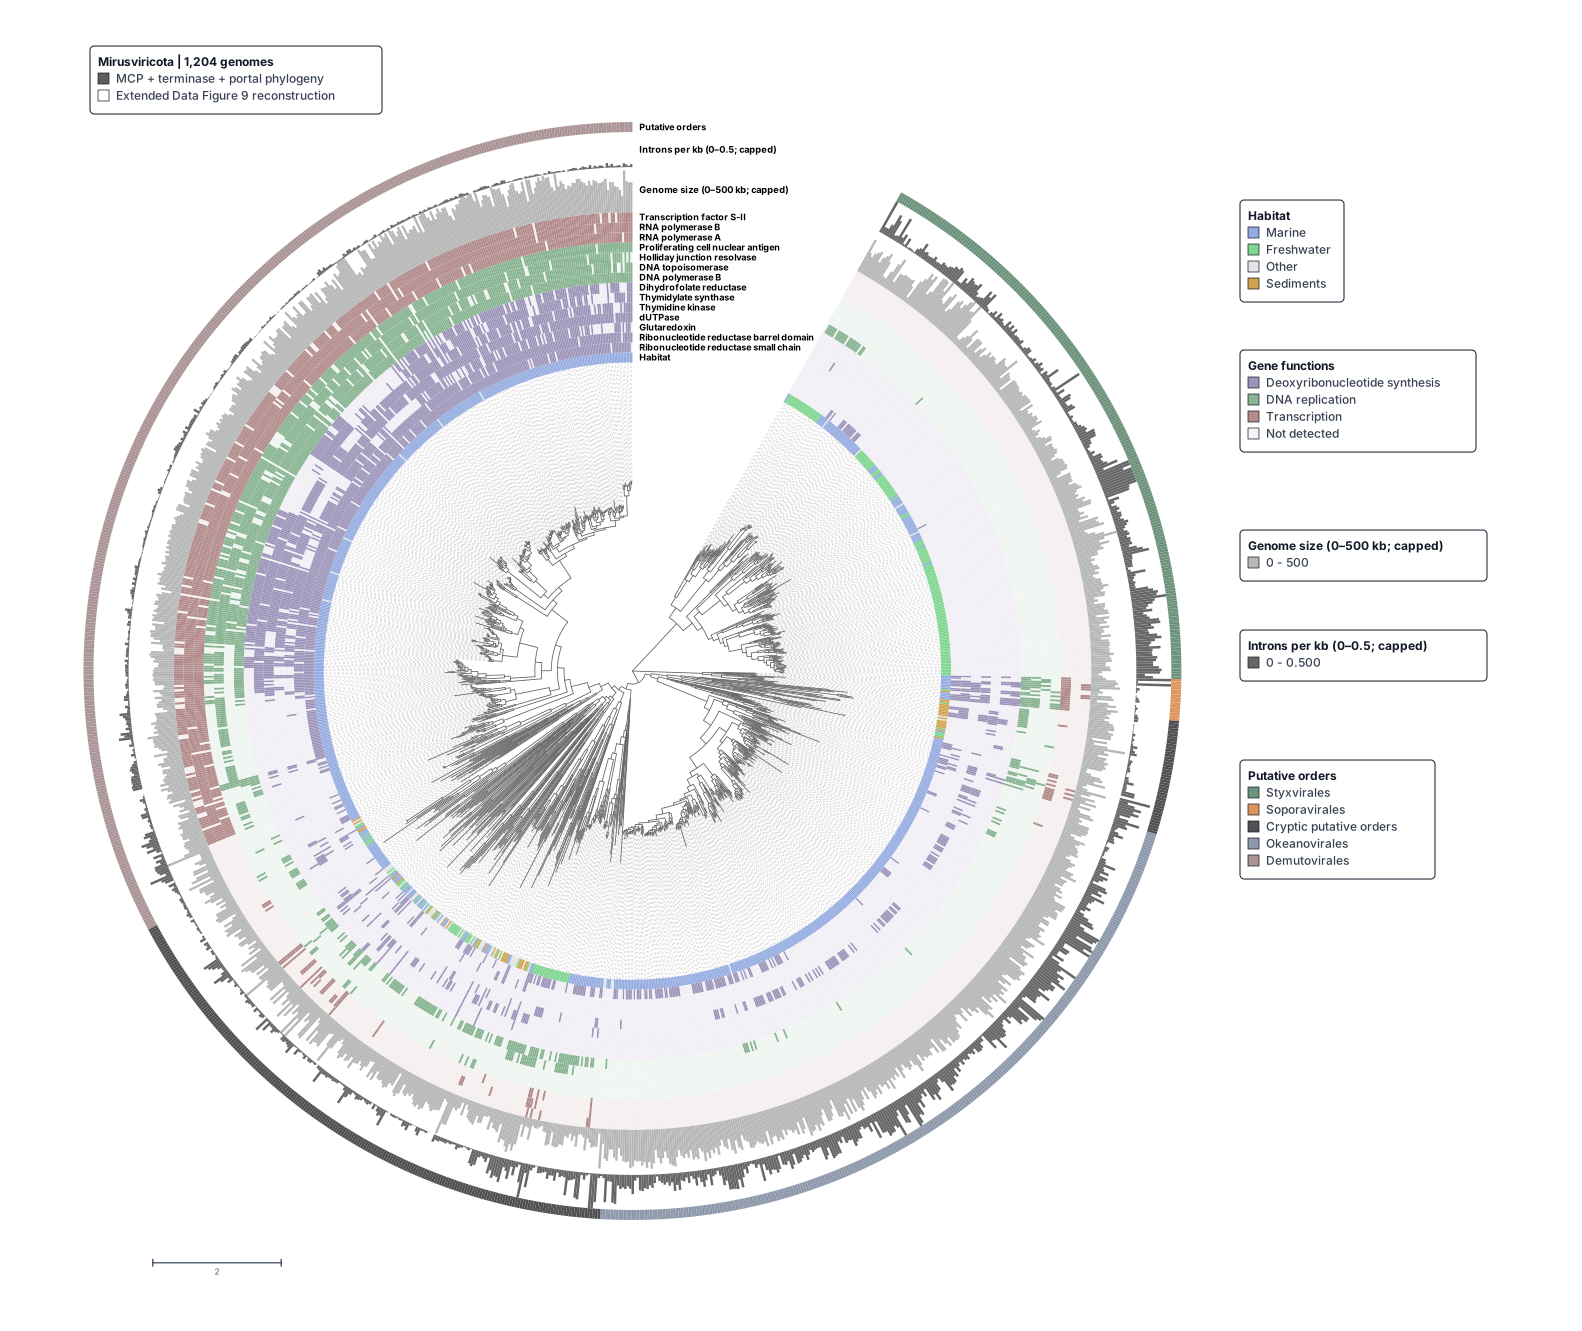
Here the Mirusviricota phylogeny from Extended Data Figure 9 in Medvedeva et al. (2026) appears as a saved TreeViz view. The tree carries 18 metadata tracks, and the fitted circular opening leaves room for their names to stay visible.
Open in TreeViz · SVG figure · Medvedeva et al. (2026) · Style prompt and metadata requirements
Files: session.treeviz.json · tree.nwk · metadata.tsv · metadata-audit.json
Example 2: SILVA taxonomy
Sourced data · 3,257 tips · circular tree
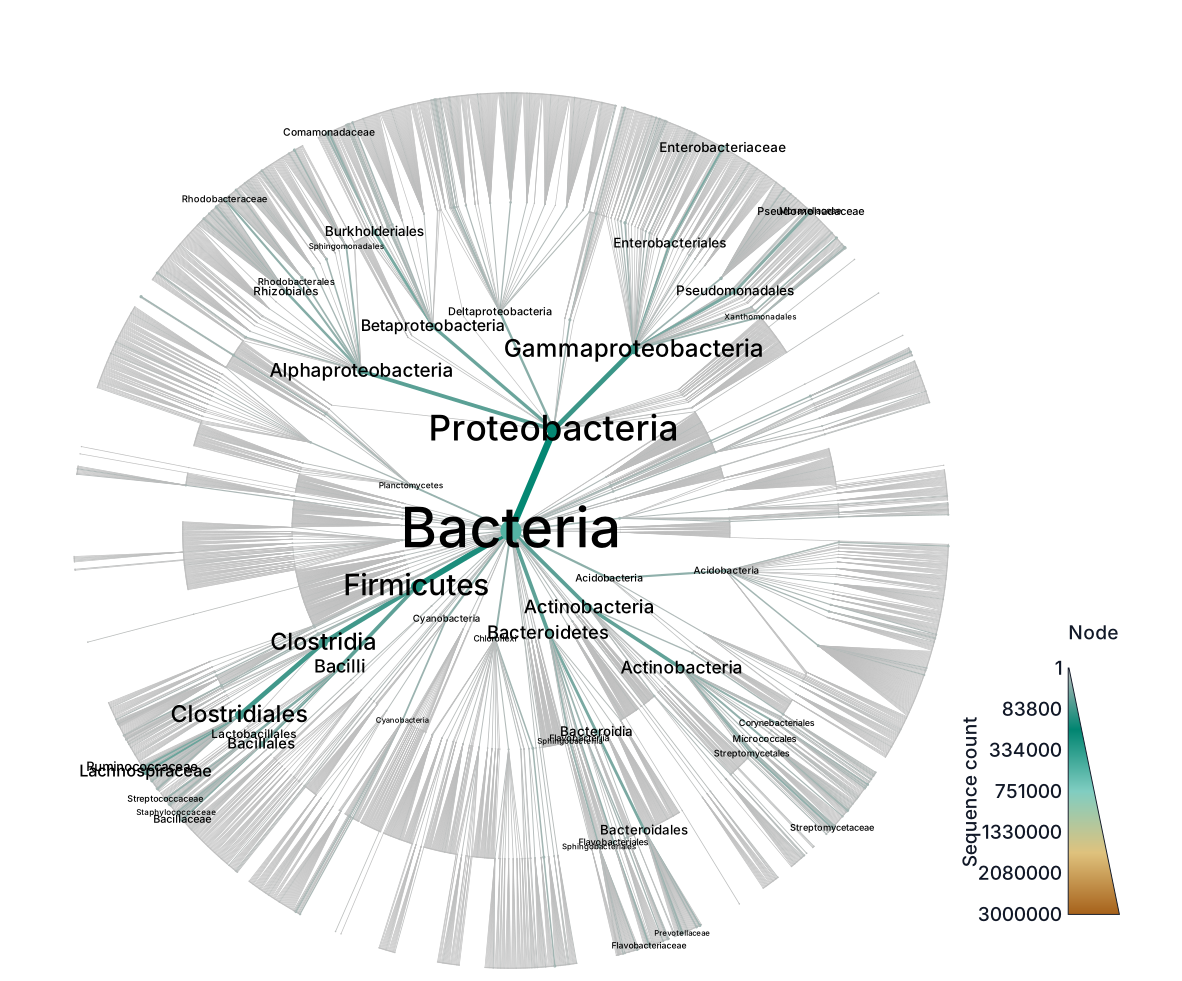
Built on the 3,843-taxon SILVA 123.1 taxonomy, this saved view reconstructs the upper-left SILVA Whole database panel of Figure 4 from Foster et al. (2017). Node diameters, branch widths, and colors together encode the 513,121 bacterial 16S sequences assigned across the taxonomy. Labels appear on 50 selected taxa.
Branch depth is the number of steps through the taxonomy. The circular angles come from a reconstruction with the historical igraph 1.0.1 layout algorithm that the source workflow used, not from measurements of the saved 2017 plot.
Open in TreeViz · SVG figure · Foster et al. (2017) · Style prompt and metadata requirements
Files: session.treeviz.json · tree.nwk · metadata.tsv · data-audit.json
Example 3: TARA Oceans Metazoa
Sourced data · 275 tips · radial tree
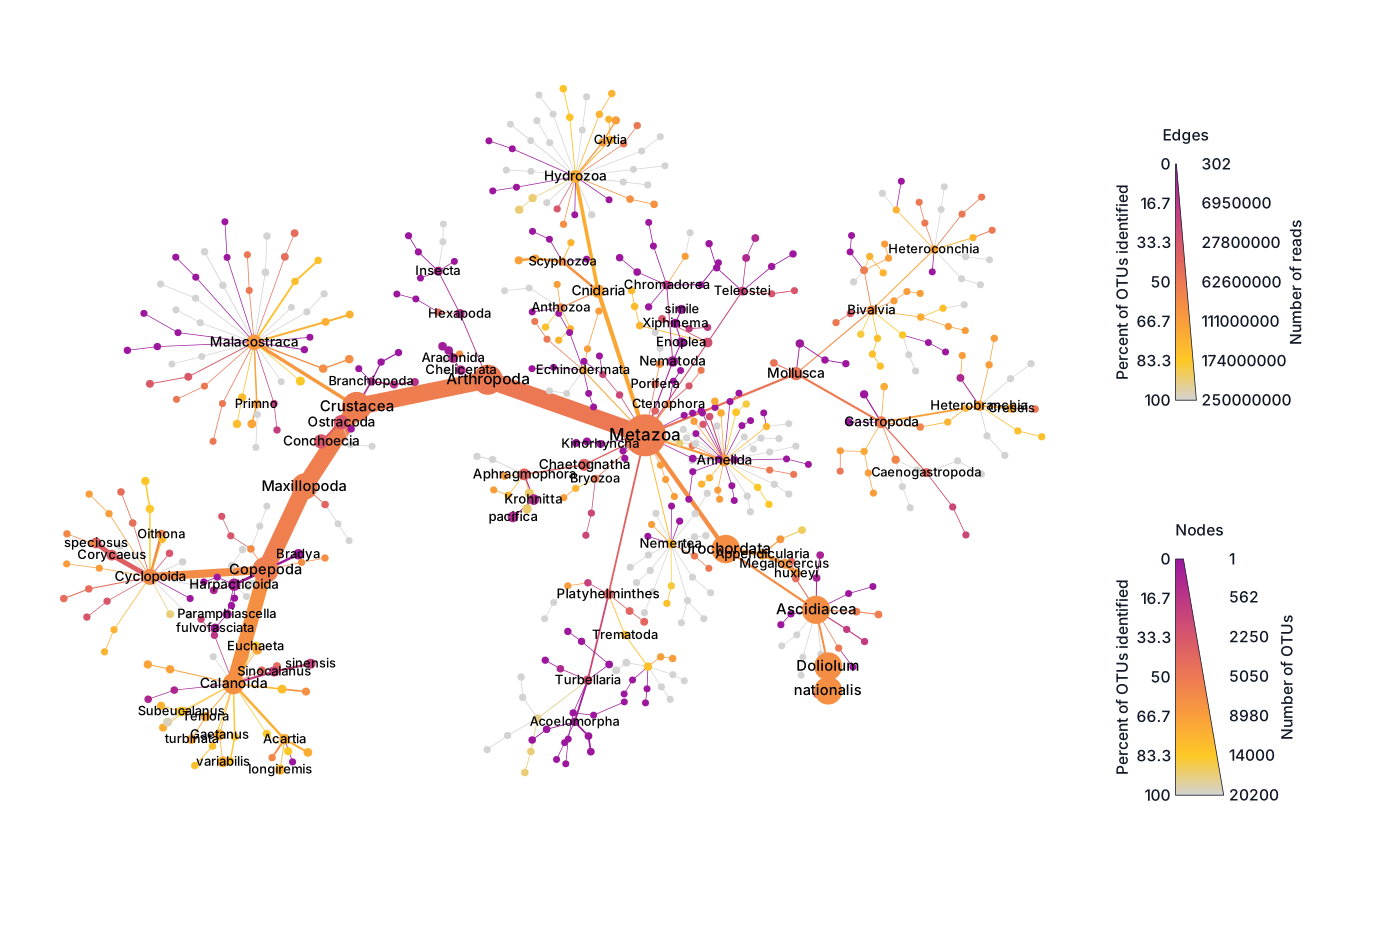
The upper Metazoa panel of Figure 3a from Foster et al. (2017) is reconstructed here from a taxonomy of 550 taxa. Circle sizes represent the 20,212 OTUs, and branch widths represent 250,296,231 reads. Following the archived code, color shows the percentage of OTUs whose closest reference sequence is at least 90% identical. Two legends show the independent percentage and count scales.
The published TARA Oceans W5 data and plotting recipe supply the taxonomy, statistics, colors, and the 73 selected labels. Display positions, on the other hand, are reconstructed. Named nodes are aligned to the published raster, and the remaining nodes follow the reconstructed local geometry. The session keeps these positions as editable node attributes.
Open in TreeViz · SVG figure · Foster et al. (2017) · Style prompt and metadata requirements
Files: session.treeviz.json · tree.nwk · metadata.tsv · layout-landmarks.json · data-audit.json
Example 4: Archaeal gene acquisitions
Sourced topology, synthetic transfer weights · 178 tips · circular tree
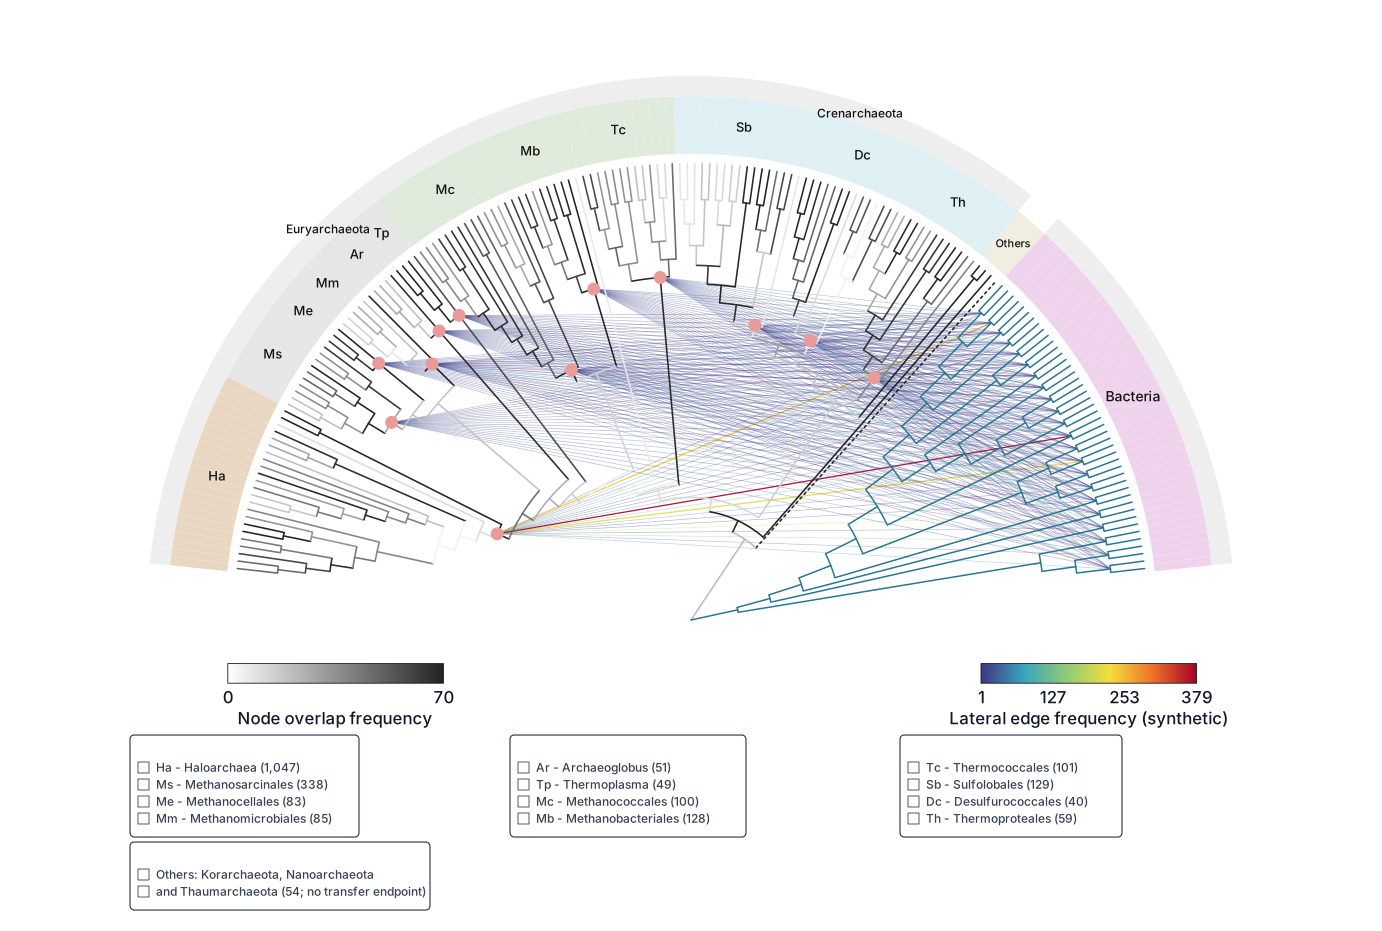
This example reconstructs Figure 3 of Nelson-Sathi et al. (2015), found on page 4 of the paper PDF. Its published topology holds 134 archaeal genomes plus 44 placeholder tips that stand for 22 bacterial groups. Shades of gray on the branches show agreement with 70 single-gene trees, and for display, terminal branches take their color from the parent's agreement.
Twelve acquisition nodes link to the bacterial groups through 264 straight lines. Because the source supplements do not include the transfer matrix, the pairwise weights are synthetic. The session keeps the published group counts separately and notes where the paper's counts disagree. Branch lengths and node angles are reconstructed display geometry, and each of the two color scales has a horizontal legend.
The session restores the full figure. transfer-metadata.tsv holds the
synthetic transfer table.
Open in TreeViz · SVG figure · Nelson-Sathi et al. (2015) · Style prompt and metadata requirements
Files: session.treeviz.json · tree.nwk · metadata.tsv · node-metadata.tsv · transfer-metadata.tsv · archaeal-groups.tsv · source-backbone.newick · layout-landmarks.json · data-audit.json
Example 5: Tree of life
Sourced data · 3,083 tips · radial tree
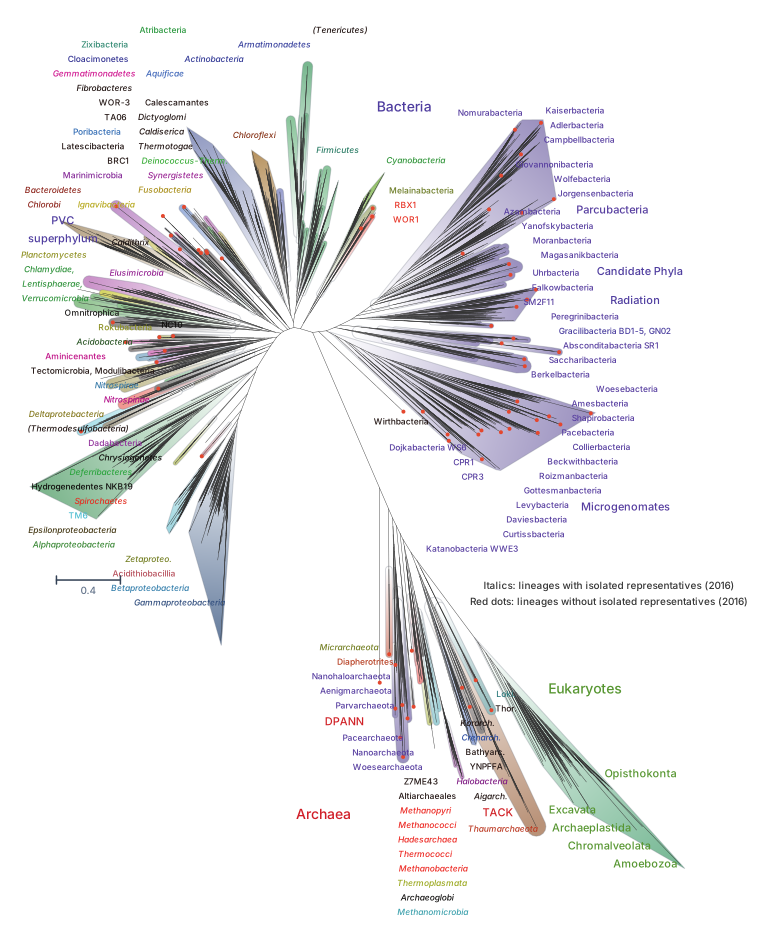
This view reconstructs Figure 1 from Hug et al. (2016). The published ribosomal-protein tree contains 3,083 tips spanning Bacteria, Archaea and Eukaryota. The session preserves its topology, terminal names, and branch lengths; the source Newick has no support values. All 3,083 tips remain expanded.
An equal-angle phylogram reconstructs the geometry because exact coordinates
cannot be recovered from the flattened PDF vectors. The session renders 135
source concepts as 137 lineage and domain text rows, plus two convention notes,
and uses 167 white-to-color clade backgrounds. Labels retain the paper's 2016
taxonomy, typography and markers. The source legend guides their interpretation;
cultivation status was not checked independently. The gradients reconstruct
source colors and do not encode measurements. The data audit (data-audit.json) records the label
mappings, including the 614 leaves without a specific-lineage assignment. It
separates published data from reconstructed coordinates and styling.
Open in TreeViz · SVG figure · Hug et al. (2016) · Style prompt and metadata requirements
Files: session.treeviz.json · tree.nwk · metadata.tsv · node-metadata.tsv · source-tree.nwk · data-audit.json
Example 6: S. aureus CC398
Sourced metadata, reconstructed tree · 3,128 tips · rectangular tree

This saved view reconstructs Figure 2 from Fernandez et al. (2024). The editable rectangular session contains 3,128 tips with matching metadata rows. Molecular annotations come from Supplementary Data 1; continent and host display groups follow the figure's colored cells. The fixture records differences between the supplement and the plotted annotations.
No original Newick or table of dated branch lengths was found. The fixture uses an approximate topology and display branch distances recovered from the vector figure. These distances reproduce the printed geometry; they are not evolutionary distances or time estimates.
Two tips in the figure carry the label SAMN39605011. Figure row 2231 is linked
to Supplementary Data 1 accession SAMN39605010 because its vector profile is
compatible and, once the other rows are mapped, it is the only workbook
accession left. The profile by itself is not unique, and both the metadata and
the data audit mark this inference. Each of the two tree keys has an explicit
figure-row suffix, so their annotations bind separately.
Open in TreeViz · SVG figure · Fernandez et al. (2024) · Style prompt and metadata requirements
Files: session.treeviz.json · tree.nwk · metadata.tsv · figure-tree.nwk · data-audit.json
Example 7: PhyloPhlAn microbial tree of life
Sourced data · 3,171 tips · circular tree

This view adapts Figure 1 from Segata et al. (2013). It retains the preserved PhyloPhlAn backbone's 3,171 tip names, branch lengths, support values and unresolved splits. Annotations show taxonomy and marker completeness. Layout and colors are adapted for TreeViz.
The published figure adds 566 genomes to this backbone. Their placements were
not recovered, so the example contains 3,171 of the figure's 3,737 genomes.
The source tree (source-tree.nwk) and its MIT license notice
(SOURCE-LICENSE.txt) are hosted with the session.
Open in TreeViz · SVG figure · Segata et al. (2013) · Style prompt and metadata requirements
Files: session.treeviz.json · tree.nwk · metadata.tsv · source-tree.nwk · SOURCE-LICENSE.txt · data-audit.json
Example 8: Bioreactor MAGs
Sourced metadata, reconstructed tree · 183 tips · circular tree

This view reconstructs Figure 7 from Mills et al. (2025). Taxonomy, GC content, and completeness for the 183 plotted bins come from the supplement, while topology and branch distances are taken from the vector figure. Those distances describe the drawing, not evolutionary change.
Neither the matching MAG tree nor the per-sample abundance matrix was supplied. Heatmap cells keep their published colors as display categories, and no abundance measurements are inferred from them. The metadata, legends, and data audit all note this limit.
Open in TreeViz · SVG figure · Mills et al. (2025) · Style prompt and metadata requirements
Files: session.treeviz.json · tree.nwk · metadata.tsv · figure-tree.nwk · data-audit.json
Example 9: HMP and MetaHIT gut microbiota
Sourced profiles, reconstructed layout · 135 tips · circular tree

This view adapts Figure 3a from Segata et al. (2012), drawing on the archived MetaPhlAn table of 139 HMP and 85 MetaHIT samples. The table's taxonomic lineages define the tree. Branch lengths count taxonomy steps, so they are not evolutionary distances. Abundance and cohort annotations are derived from the source profiles, and the layout is reconstructed.
The table contains 290 taxa and 135 terminal clades, including 123 species-level rows. The paper reports 102 species for the combined cohorts; 102 instead matches HMP alone in the archived table. The example retains all source rows and records this discrepancy.
The archived profiles (source-profiles.tsv) are hosted with the session, so
the cohort calculations can be checked.
Open in TreeViz · SVG figure · Segata et al. (2012) · Style prompt and metadata requirements
Files: session.treeviz.json · tree.nwk · metadata.tsv · node-metadata.tsv · source-profiles.tsv · reconstructed-taxonomy.nwk · data-audit.json